What is an ECG
An Electrocardiogram, commonly known as an ECG or EKG, is a fundamental diagnostic tool used in the medical field to assess the electrical activity of the heart. This non-invasive procedure involves placing electrodes on the skin’s surface, strategically positioned to capture the heart’s electrical signals.
The terminology, ECG and EKG, may seem interchangeable, causing confusion among learners in the medical field. The discrepancy arises from linguistic variations. ECG is derived from the original German term “Elektrokardiogramm,” while EKG stems from the English translation, “Electrocardiogram.” Both terms are widely accepted, with ECG being more prevalent in European and international contexts, and EKG being the preferred term in the United States.
Understanding the nuances between ECG and EKG is crucial for medical practitioners. The core principles and the procedure remain the same regardless of the terminology used. An ECG provides a graphical representation of the heart’s electrical activity over time, offering valuable insights into its rhythm and function.
In essence, an ECG acts as a visual storyteller, translating the heart’s intricate electrical language into a comprehensible narrative for healthcare professionals. This tool plays a pivotal role in diagnosing various cardiac conditions, guiding treatment plans, and monitoring the effectiveness of interventions.
As we embark on this journey through the realm of electrocardiography, let’s delve deeper into the rich history of this diagnostic marvel in the subsequent section.
History of an ECG
The origin of the Electrocardiogram (ECG) is a tale woven into the fabric of medical innovation, a narrative that stretches across time and continents. Our journey into the history of the ECG takes us back to the early 20th century, where a visionary named Willem Einthoven laid the foundation for a revolutionary diagnostic tool.
In 1901, Einthoven, a Dutch physiologist, unveiled the first string galvanometer, a device that could detect and record the electrical impulses generated by the heart. His groundbreaking invention marked the birth of electrocardiography, forever altering the landscape of cardiovascular medicine. Einthoven’s dedication earned him the Nobel Prize in Physiology or Medicine in 1924, solidifying his legacy as the father of the ECG.
The early ECG machines were intricate, cumbersome contraptions, requiring considerable expertise to operate. Over the subsequent decades, technological advancements led to the development of more portable and user-friendly devices, democratizing access to electrocardiography. This evolution allowed healthcare professionals worldwide to harness the power of the ECG in diverse clinical settings.
As the years unfolded, so did the capabilities of the ECG. The introduction of 12-lead ECGs expanded the diagnostic potential, enabling a more comprehensive assessment of the heart’s electrical activity. Continuous refinements in electrode placement, signal processing, and recording techniques further enhanced the ECG’s accuracy and reliability.
The integration of digital technology in recent years has propelled the ECG into the digital age, facilitating easier storage, analysis, and sharing of electrocardiographic data. Mobile ECG devices and wearable monitors have brought this diagnostic tool closer to patients, offering real-time insights and fostering a proactive approach to cardiovascular health.
In the realm of medical education, the ECG has become a cornerstone of cardiology curricula. Understanding the historical journey of this diagnostic marvel not only pays homage to its pioneers but also provides context for the profound impact it continues to have on patient care.
As we stand on the shoulders of Einthoven and his contemporaries, our exploration of the ECG’s mechanics in the upcoming sections will deepen our appreciation for this enduring legacy of medical ingenuity. Join me as we unravel the intricate dance of electrical impulses that shape the heartbeat and unveil the secrets hidden within the lines of the ECG paper.
How does an ECG work
Embarking on the journey of understanding how an Electrocardiogram (ECG) works is akin to deciphering the intricate language of the heart’s electrical symphony. Picture the ECG as a musical score, with each line and wave representing a note in the rhythmic composition of cardiac activity.
At the core of the ECG process lies the ECG paper, a canvas that captures the nuanced dance of electrical impulses coursing through the heart. The paper, marked by a grid pattern, serves as a temporal and spatial map, providing a visual representation of the heart’s electrical events.
Let’s delve into the anatomy of the ECG paper. The horizontal axis represents time, measured in seconds, while the vertical axis quantifies voltage or electrical potential, measured in millivolts (mV). The gridlines divide the paper into small squares, each square representing a specific duration and voltage.
Understanding the concept of millivolts is pivotal. It represents the amplitude of the electrical signals produced by the heart. As the heart contracts and relaxes, it generates electrical impulses, creating waves on the ECG. The amplitude of these waves corresponds to the strength of the electrical signals.
Now, as we explore the landscape of the ECG paper, we encounter distinct components within each box. The P wave marks the atrial depolarization, signaling the contraction of the atria. The QRS complex captures the ventricular depolarization, indicating the contraction of the ventricles. Finally, the T wave signifies ventricular repolarization, denoting the relaxation of the ventricles.
Understanding the duration and amplitude of these waves is pivotal for accurate interpretation. The horizontal axis helps measure time intervals, and each small square typically represents 0.04 seconds, while larger squares represent 0.2 seconds. On the vertical axis, each small square often signifies 0.1 mV, providing a scale to assess the amplitude of the waves.
As we immerse ourselves in the mechanics of an ECG, envision the paper as a musical staff where each note, each wave, carries vital information about the heart’s rhythm and function. The ECG, with its precise measurements and intricate details, transforms the silent beats of the heart into a visual masterpiece, allowing healthcare professionals to decipher the melodies of cardiovascular health.
In the upcoming sections, we’ll unravel the significance of different leads and explore the multifaceted dimensions of the ECG, deepening our understanding of this remarkable diagnostic tool. Join me as we venture into the heart of electrocardiography, where every line on the ECG paper tells a story of life, rhythm, and vitality.
Different ECG Leads
In the intricate landscape of electrocardiography, understanding the significance of ECG leads is akin to navigating through the diverse chapters of a complex novel. Each lead, like a narrative thread, weaves a unique story of the heart’s electrical activity, providing healthcare professionals with a comprehensive view of cardiac function.
Lead Basics: Before delving into the specific roles of different leads, let’s unravel the basic premise. In ECG, a lead refers to a specific viewpoint or perspective from which the electrical activity of the heart is observed. These leads are categorized into limb leads and precordial (chest) leads.
Limb Leads: The limb leads (I, II, III, aVR, aVL, aVF) are like windows into the heart’s electrical performance from different angles. Lead I captures electrical activity between the right and left arms, Lead II between the right leg and left arm, and Lead III between the right leg and left arm. Augmented Vector Right (aVR), Augmented Vector Left (aVL), and Augmented Vector Foot (aVF) provide unique perspectives, contributing to a holistic understanding of the heart’s electrical behavior.
Precordial Leads: The precordial leads (V1 to V6) are placed on the chest, each overlying a specific region of the heart. These leads offer a detailed portrayal of the heart’s anterior, lateral, and posterior surfaces. Picture these leads as chapters, each unveiling a distinct aspect of the cardiac narrative.
Lead Placement: The precise placement of ECG leads is a critical aspect of accurate readings. Limb leads are typically positioned on the wrists and ankles, while precordial leads are carefully situated along the chest wall. This meticulous arrangement ensures that the electrical signals captured represent the heart’s activity faithfully.
Lead Patterns and Primary Lead: As we explore the world of ECG leads, understanding lead patterns is paramount. Different leads showcase varying aspects of the cardiac cycle, contributing to the comprehensive interpretation of the ECG. Lead II, for instance, is often considered the primary lead, offering a view of the heart’s electrical activity in the frontal plane.
Common lead patterns, such as the standard 12-lead ECG, amalgamate information from multiple leads to provide a holistic depiction of the heart’s electrical performance. Recognizing these patterns aids in the identification of abnormalities, guiding clinicians towards accurate diagnoses.
Purpose of Leads: The purpose of ECG leads extends beyond mere observation; they play a pivotal role in diagnosing and understanding cardiac conditions. Leads may reveal ischemia, injury, or infarction in specific regions of the heart, guiding interventions and treatment plans.
As we navigate the vast expanse of ECG leads, envision them as storytellers, each contributing a unique chapter to the epic tale of cardiac health. In the upcoming sections, we’ll unravel the intricacies of the cardiac cycle, exploring the waves and segments that unfold within the narrative, and deepen our understanding of electrocardiography’s symphony. Join me as we embark on this journey into the heart’s electrical realms, where every lead holds a key to deciphering the mysteries of cardiovascular health.
The Cardiac Cycle
Unlocking the Symphony of the Heart: A Journey Through the Cardiac Cycle
The cardiac cycle, akin to a musical composition, orchestrates the rhythmic dance of the heart’s chambers, generating the intricate pattern we observe on an electrocardiogram (ECG). In this exploration, we embark on a journey through the different phases, waves, and segments that constitute the symphony of the cardiac cycle.
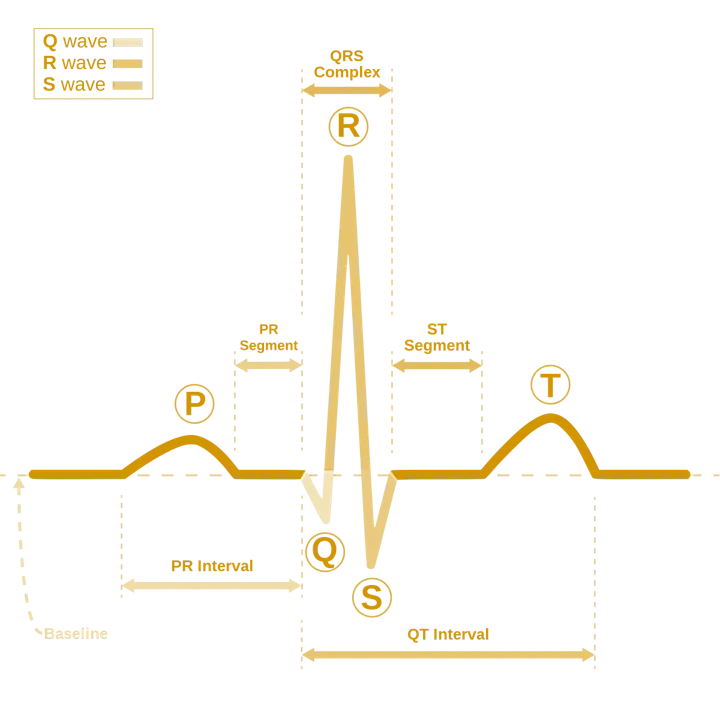
1. P Wave: The Prelude Our journey commences with the P wave, the introductory melody. Representing atrial depolarization, this small upward deflection on the ECG marks the initiation of the cardiac cycle. It signifies the contraction of the atria, preparing for the orchestration of the grand performance.
2. PR Segment: The Anticipation Following the P wave, we encounter the PR segment, a brief pause that builds anticipation. This interval signifies the delay at the atrioventricular (AV) node, allowing the ventricles time to fill before the next phase of the cycle.
3. Q Wave: The Rising Crescendo As the cycle unfolds, the Q wave signals the beginning of ventricular depolarization. This initial downward deflection sets the stage for the powerful surge of electrical activity that will propel the cardiac symphony forward.
4. R Wave: The Climactic Peak The R wave, majestic and towering, represents the peak of ventricular depolarization. Its amplitude signifies the strength of the electrical signal coursing through the ventricles, reaching its zenith before the descent into the S wave.
5. S Wave: The Graceful Descent The S wave follows the R wave, symbolizing the completion of ventricular depolarization. As the electrical activity wanes, this downward deflection elegantly concludes the ventricular phase, paving the way for the next act in the cardiac cycle.
6. F Wave: The Atrial Flutter (Optional) The F wave, if present, may indicate atrial flutter—a rapid, regular atrial rhythm. This fluttering motif, if introduced, adds a unique nuance to the cardiac composition, accentuating the complexity of potential cardiac rhythms.
7. ST Segment: The Plateau of Rest The ST segment is a momentary plateau of rest, representing the interval between ventricular depolarization and repolarization. This segment is crucial for assessing myocardial perfusion and identifying potential ischemic events.
8. T Wave: The Repolarization Cadence The T wave follows, marking the ventricular repolarization. Its upward deflection signifies the return to the resting state, preparing the heart for the subsequent cycles of contraction. The T wave is a crucial chapter in the cardiac narrative, ensuring the harmonious rhythm of the heart.
9. TP Segment: The Transition The TP segment serves as the transition between ventricular repolarization and the next atrial depolarization. This brief pause allows for the heart to reset, marking the intermission before the commencement of a new cardiac cycle.
10. U Wave: The Enigmatic Encore (Optional) The U wave, if observed, adds an enigmatic touch to the cardiac score. While its exact significance remains debated, it may represent the late repolarization of the Purkinje fibers or electrolyte imbalances, contributing a subtle undertone to the ECG composition.
As we navigate the intricacies of the cardiac cycle, remember that each wave, segment, and interval is a note in the symphony of the heart’s rhythmic dance. Understanding their sequence and significance allows clinicians to decipher the ECG score, revealing the health and vitality of this vital organ. The duration and amplitude, as discussed in Section 3.1, weave the fabric of this intricate composition, offering insights into the dynamic interplay of electrical forces that sustain life.
Decoding Heart Rate
Metrics and Methodologies
Understanding heart rate calculations is a fundamental skill for any medical professional venturing into the realm of Electrocardiography (ECG). This section serves as your guide, unraveling the intricacies of heart rate determination from the ECG graph paper. From the basics to advanced calculations tailored for abnormal rhythms, let’s embark on a journey to decipher the pulse of the electrocardiogram.
Basic Heart Rate Calculation: The most straightforward method to calculate heart rate from an ECG is by measuring the distance between R waves, known as the RR interval. The formula for heart rate (HR) is:
HR = 60/RR interval in seconds
This calculation provides the heart rate in beats per minute (bpm). For normal sinus rhythm, where the RR intervals are regular, this method is quite effective.
Advanced Heart Rate Calculations:
-
R-R Interval Averaging: In situations where RR intervals are irregular, such as in atrial fibrillation, averaging several RR intervals provides a more accurate heart rate. For example, if three RR intervals are measured as 0.8, 1.0, and 0.9 seconds:
Average RR Interval = (0.8 + 1.0 + 0.9)/3 = 0.9 seconds
Then, calculate heart rate using the formula mentioned earlier.
-
Using Six-Second Method: In a 6-second ECG strip, count the number of R waves and multiply by 10 to obtain the heart rate. This method is particularly useful in emergency situations or when a full 12-lead ECG is not available.
HR = (Number of R waves in 6 seconds) x 10
Applying Calculations to ECG Graph Paper:
-
Identifying R Waves: Locate R waves on the ECG graph paper. Ensure consistency in measurement and choose consecutive R waves for accurate calculations.
-
Measuring RR Intervals: Use calipers or a ruler to measure the distance between consecutive R waves, representing the RR interval. Consistency is key for precise calculations.
-
Calculating Heart Rate: Apply the relevant formula based on the method chosen for heart rate calculation. For irregular rhythms, consider averaging RR intervals or using advanced methods.
Conclusion: Heart rate calculations are the pulse-reading skills of ECG interpretation. Armed with these calculations, a medical professional can unravel the rhythmic intricacies of the heart, discerning not just the regular cadence but also nuances in irregularities. Join me in the upcoming sections as we delve deeper into the electrocardiographic landscape, demystifying the language of the heart’s electrical symphony.
Harmony of the Heart
Understanding Cardiac Rhythms
In the symphony of cardiovascular health, the concept of cardiac rhythms emerges as a central melody, orchestrating the beats that echo through the chambers of the heart. Here we aim to unravel the essence of cardiac rhythms, delving into their theoretical foundations, unraveling the historical threads that have woven our understanding of these rhythmic patterns.
Defining Cardiac Rhythm: At its core, a cardiac rhythm is the ordered sequence of electrical events that govern the heart’s contractions and relaxations. Picture it as the conductor guiding the heart’s orchestra through the harmonious dance of systole and diastole, each rhythm telling a unique story of cardiac function.
Evolution of Rhythm Understanding: Our journey into the world of cardiac rhythms begins with a historical perspective. Early pioneers like Willem Einthoven, armed with the first electrocardiogram (ECG) machines, laid the groundwork for identifying and understanding these rhythmic patterns. Over the years, advancements in technology, coupled with extensive clinical research, have expanded our repertoire of recognized rhythms.
Theory of Rhythms: The study of cardiac rhythms involves decoding the intricate language of the heart’s electrical impulses. Normal sinus rhythm serves as the baseline, representing the heart’s optimal functioning. Any deviation from this norm prompts an exploration into the underlying causes, unveiling potential cardiac disorders.
Diagnostic Significance: Cardiac rhythms, when analyzed, provide a wealth of diagnostic information. They serve as potent indicators of the heart’s electrical stability or instability. For instance, irregularities like atrial fibrillation or ventricular tachycardia may signify underlying cardiovascular issues, necessitating further investigation and intervention.
Relation to Cardiac Cycle: Understanding cardiac rhythms necessitates an appreciation of their intimate connection with the cardiac cycle. Each rhythm is essentially a sequence of cardiac cycles, where the heart undergoes the rhythmic process of contraction (systole) and relaxation (diastole). The interplay between the cardiac cycle and rhythms is a dynamic dialogue that echoes the heart’s health.
Clinical Implications: Beyond theoretical understanding, the clinical implications of recognizing different rhythms are profound. Identifying abnormal rhythms informs clinicians about potential risks, guides treatment strategies, and aids in predicting outcomes. Cardiac rhythms, thus, serve as both diagnostic tools and prognostic indicators in the realm of cardiology.
As we traverse the theoretical landscape of cardiac rhythms, envision them as the heart’s poetic expression, a rhythmic language that speaks volumes about cardiovascular health. Join me in the subsequent sections as we delve into the specifics of various cardiac rhythms, exploring their unique tales and unraveling the mysteries they hold within the ECG lines.
Normal Sinus Rhythm
A Symphony of Cardiovascular Health
In the vast lexicon of cardiac rhythms, the Normal Sinus Rhythm (NSR) stands as the virtuoso performer, embodying the harmonious orchestration of the heart’s electrical activity. This section endeavors to unravel the nuances of NSR, offering a profound understanding of what it is, its significance, and how its melody resonates within the intricacies of an Electrocardiogram (ECG).
Defining Normal Sinus Rhythm: Normal Sinus Rhythm is the benchmark, the gold standard of cardiac health. It represents the ideal sequence of electrical impulses governing the heart’s contractions, orchestrating a rhythmic ballet between atrial and ventricular chambers. NSR is characterized by the following key features:
- A regular rhythm: The intervals between successive R waves remain consistent.
- A heart rate between 60 to 100 beats per minute in adults.
- A P wave preceding each QRS complex.
- A PR interval within the normal range of 0.12 to 0.20 seconds.
- A QRS complex duration less than 0.12 seconds.
Identifying NSR on an ECG: Discerning NSR on an ECG involves a keen eye for the characteristic patterns that signify optimal cardiac function:
- Regular Rhythm: The intervals between R waves should maintain a consistent pattern.
- P Waves Preceding QRS Complex: Each QRS complex should be preceded by a P wave, signifying the atrial depolarization.
- Normal Heart Rate: The heart rate falls within the range of 60 to 100 beats per minute.
Primary Lead for NSR Identification: The primary lead for identifying NSR is Lead II. This lead provides an optimal view of the heart’s electrical activity in the frontal plane, offering a comprehensive portrayal of atrial and ventricular depolarization.
Cardiac Cycle Perspective: Delving into the intricacies of NSR from a cardiac cycle perspective, let’s dissect the key components:
-
P Wave: Represents atrial depolarization, indicating the initiation of the cardiac cycle. Duration and amplitude are within the normal range.
-
PR Interval: Reflects the time from atrial to ventricular depolarization. Its normal duration (0.12 to 0.20 seconds) ensures synchronized contraction.
-
QRS Complex: Signifies ventricular depolarization and contraction. The duration is less than 0.12 seconds, ensuring efficient pumping of blood.
-
ST Segment and T Wave: Mark ventricular repolarization, preparing the heart for the next cycle. Their durations and amplitudes remain within the normal range.
Number of Cardiac Cycles for Identification: To confidently identify NSR, observing a single cardiac cycle on the ECG may be adequate. However, a continuous strip of ECG, spanning several seconds, enhances accuracy in confirming the regularity of the rhythm.
Clinical Significance of NSR: Normal Sinus Rhythm is synonymous with cardiovascular well-being. Its presence indicates an optimally functioning heart, efficiently pumping blood and maintaining circulatory integrity. NSR serves as the baseline for rhythm comparisons, enabling clinicians to identify deviations that may indicate underlying cardiac issues.
Conclusion: In the realm of cardiac rhythms, the Normal Sinus Rhythm stands as the pinnacle of health, a testament to the heart’s ability to maintain a rhythmic equilibrium. As we conclude our exploration of NSR, envision it as the heart’s anthem of vitality, echoing through the corridors of cardiovascular excellence.
Sinus Tachycardia Rhythm
The Accelerated Ballet of the Heart
In the intricate tapestry of cardiac rhythms, Sinus Tachycardia emerges as a dynamic composition, a heartbeat that quickens its tempo in response to various physiological triggers. This section embarks on an exploration of Sinus Tachycardia, unraveling its essence, decoding its meaning, and illuminating the ECG landscape where its presence orchestrates a rapid cardiovascular performance.
Defining Sinus Tachycardia: Sinus Tachycardia is characterized by an elevated heart rate, typically surpassing 100 beats per minute in adults. Unlike some other tachyarrhythmias, Sinus Tachycardia maintains a regular rhythm with a consistent P wave preceding each QRS complex. It signifies an appropriate response to various factors such as stress, fever, anemia, or physiological demands.
Identifying Sinus Tachycardia on an ECG: Recognizing Sinus Tachycardia involves a meticulous examination of the ECG, focusing on distinctive features that define its accelerated rhythm:
-
Elevated Heart Rate: The hallmark of Sinus Tachycardia is a heart rate exceeding 100 beats per minute in adults.
-
Regular Rhythm: The intervals between successive R waves remain consistent, distinguishing it from other irregular tachyarrhythmias.
-
P Wave Preceding QRS Complex: Each QRS complex is preceded by a P wave, indicating that the impulse originates in the sinoatrial (SA) node.
Primary Lead for Sinus Tachycardia Identification: The primary lead for identifying Sinus Tachycardia is often Lead II. This lead provides an optimal view of the heart’s electrical activity, allowing for a comprehensive assessment of atrial and ventricular depolarization.
Cardiac Cycle Perspective: Examining Sinus Tachycardia from a cardiac cycle perspective involves dissecting the key components, noting alterations in duration and amplitude:
-
P Wave: Represents atrial depolarization, initiating the cardiac cycle. In Sinus Tachycardia, the P wave duration and amplitude remain within normal limits.
-
PR Interval: Reflects the time from atrial to ventricular depolarization. Despite the increased heart rate, the PR interval typically remains constant.
-
QRS Complex: Signifies ventricular depolarization and contraction. Its duration remains within the normal range.
-
ST Segment and T Wave: Mark ventricular repolarization, preparing the heart for the next cycle. While the duration may be slightly reduced, the amplitude generally remains unaffected.
Number of Cardiac Cycles for Identification: Observing a continuous strip of ECG for a brief duration, typically 10 to 15 seconds, is usually sufficient to identify Sinus Tachycardia. The elevated heart rate and regular rhythm become evident within this timeframe.
Clinical Significance of Sinus Tachycardia: Sinus Tachycardia is often a physiological response to stress, fever, pain, or increased metabolic demands. While it can be a normal and adaptive reaction, persistent or excessive tachycardia may warrant further investigation to identify and address underlying causes.
Conclusion: In the intricate ballet of cardiac rhythms, Sinus Tachycardia takes center stage as a performance influenced by the body’s dynamic needs. As we conclude our exploration, envision Sinus Tachycardia as the heart’s swift response to life’s demands, a rhythm that mirrors the resilience and adaptability of cardiovascular health.
Sinus Bradycardia Rhythm
The Deliberate Ballet of the Heart
In the intricate choreography of cardiac rhythms, Sinus Bradycardia emerges as a deliberate and measured dance, where the heart embraces a slower rhythm, orchestrating each beat with a deliberate grace. This section delves into the essence of Sinus Bradycardia, unraveling its significance, elucidating the ECG canvas where its unhurried performance paints a portrait of cardiovascular health.
Defining Sinus Bradycardia: Sinus Bradycardia is characterized by a heart rate slower than the normal range, typically below 60 beats per minute in adults. Contrary to pathological bradycardias, Sinus Bradycardia retains a regular rhythm with a P wave preceding each QRS complex. It can be a normal variation in well-conditioned athletes or a response to enhanced vagal tone.
Identifying Sinus Bradycardia on an ECG: Discerning Sinus Bradycardia involves a meticulous examination of the ECG, focusing on key features that define its unhurried rhythm:
-
Slower Heart Rate: The hallmark of Sinus Bradycardia is a heart rate below 60 beats per minute in adults.
-
Regular Rhythm: The intervals between successive R waves remain consistent, distinguishing it from other irregular bradyarrhythmias.
-
P Wave Preceding QRS Complex: Each QRS complex is preceded by a P wave, signifying that the impulse originates in the sinoatrial (SA) node.
Primary Lead for Sinus Bradycardia Identification: The primary lead for identifying Sinus Bradycardia is often Lead II. This lead provides an optimal view of the heart’s electrical activity, allowing for a comprehensive assessment of atrial and ventricular depolarization.
Cardiac Cycle Perspective: Examining Sinus Bradycardia from a cardiac cycle perspective involves dissecting the key components, noting alterations in duration and amplitude:
-
P Wave: Represents atrial depolarization, initiating the cardiac cycle. In Sinus Bradycardia, the P wave duration and amplitude remain within normal limits.
-
PR Interval: Reflects the time from atrial to ventricular depolarization. Despite the slower heart rate, the PR interval typically remains constant.
-
QRS Complex: Signifies ventricular depolarization and contraction. Its duration remains within the normal range.
-
ST Segment and T Wave: Mark ventricular repolarization, preparing the heart for the next cycle. While the duration may be slightly prolonged, the amplitude generally remains unaffected.
Number of Cardiac Cycles for Identification: Observing a continuous strip of ECG for a brief duration, typically 10 to 15 seconds, is usually sufficient to identify Sinus Bradycardia. The slower heart rate and regular rhythm become evident within this timeframe.
Clinical Significance of Sinus Bradycardia: Sinus Bradycardia can be a normal variant in individuals with well-conditioned hearts, such as athletes, or a response to enhanced vagal tone. However, persistent or symptomatic bradycardia may warrant further investigation to identify and address underlying causes.
Conclusion: In the deliberate ballet of cardiac rhythms, Sinus Bradycardia takes center stage as a performance marked by measured grace. As we conclude our exploration, envision Sinus Bradycardia as the heart’s intentional cadence, a rhythm that mirrors the poise and control within cardiovascular health.
Premature Atrial Contraction Rhythm
The Untimely Solo in the Heart’s Symphony
In the intricate composition of cardiac rhythms, the Premature Atrial Contraction (PAC) emerges as an untimely solo, a transient interruption in the heart’s orchestration. This section unfolds the nuances of PAC, shedding light on its identity, decoding its implications, and navigating the ECG terrain where its irregular cadence paints a distinctive portrait within the cardiovascular symphony.
Defining Premature Atrial Contraction: Premature Atrial Contraction refers to an early, ectopic heartbeat originating in the atria before the normal initiation by the sinoatrial (SA) node. It presents as a premature P wave on the ECG, disrupting the regular rhythm of the heart. While PACs are often benign, they can be associated with underlying cardiac conditions or triggered by stimulants like caffeine or stress.
Identifying Premature Atrial Contraction on an ECG: Spotting Premature Atrial Contraction involves keen observation of the ECG, focusing on distinctive features that mark its irregular presence:
-
Premature P Wave: An early, abnormal P wave preceding the QRS complex, disrupting the regular rhythm.
-
Normal QRS Complex: The QRS complex that follows the premature P wave is typically normal, indicating that the impulse has successfully conducted to the ventricles.
Primary Lead for PAC Identification: The primary lead for identifying Premature Atrial Contraction is often Lead II. This lead provides an optimal view of the heart’s electrical activity, allowing for a comprehensive assessment of atrial and ventricular depolarization.
Cardiac Cycle Perspective: Examining Premature Atrial Contraction from a cardiac cycle perspective involves dissecting the key components, noting alterations in duration and amplitude:
-
Normal P Wave: Represents atrial depolarization in a regular cardiac cycle.
-
Premature P Wave: An untimely atrial depolarization preceding the expected P wave, causing a momentary disruption.
-
Normal PR Interval: Reflects the time from atrial to ventricular depolarization. Despite the premature beat, the PR interval usually remains within normal limits.
-
Normal QRS Complex: Signifies ventricular depolarization and contraction. Its duration remains within the normal range.
-
Normal ST Segment and T Wave: Mark ventricular repolarization, preparing the heart for the next cycle. The duration and amplitude typically remain unaffected.
Number of Cardiac Cycles for Identification: Observing a continuous strip of ECG for a brief duration, typically 10 to 15 seconds, is usually sufficient to identify Premature Atrial Contraction. The irregular presence of premature P waves becomes evident within this timeframe.
Clinical Significance of Premature Atrial Contraction: While PACs are often benign and asymptomatic, they can indicate underlying cardiac conditions, electrolyte imbalances, or heightened autonomic tone. Persistent or symptomatic PACs may warrant further investigation to identify and address potential triggers or associated cardiovascular issues.
Conclusion: In the nuanced narrative of cardiac rhythms, Premature Atrial Contraction emerges as an untimely solo, a transient deviation in the heart’s orchestration. As we conclude our exploration, envision PAC as the heart’s momentary pause, a rhythm that speaks of resilience and adaptability within cardiovascular health.
Atrial Flutter Rhythm
The Whirlwind Waltz of Atrial Contractions
In the intricate choreography of cardiac rhythms, Atrial Flutter unfolds as a whirlwind waltz, where atrial contractions take center stage, executing a rapid and organized dance. This section unveils the intricacies of Atrial Flutter, elucidating its nature, decoding its implications, and navigating the ECG landscape where its characteristic patterns compose a distinctive melody within the cardiovascular symphony.
Defining Atrial Flutter: Atrial Flutter is characterized by rapid and organized atrial contractions, often exceeding 240 beats per minute. The atria exhibit a sawtooth pattern on the ECG, with multiple atrial contractions (flutter waves) preceding each ventricular contraction (QRS complex). Atrial Flutter may be associated with structural heart disease or occur independently.
Identifying Atrial Flutter on an ECG: Recognizing Atrial Flutter involves a meticulous examination of the ECG, focusing on hallmark features that define its whirlwind dance:
-
Sawtooth Flutter Waves: A series of rapid, regular, and sawtooth-shaped waves, representing atrial contractions, typically visible in inferior leads (II, III, aVF).
-
Regular Ventricular Response: The ventricular response (QRS complexes) is typically regular, reflecting the organized conduction of atrial impulses to the ventricles.
Primary Lead for Atrial Flutter Identification: The primary lead for identifying Atrial Flutter is often Lead II, providing an optimal view of atrial activity. Additionally, leads in the inferior aspect (II, III, aVF) are crucial for visualizing flutter waves.
Cardiac Cycle Perspective: Examining Atrial Flutter from a cardiac cycle perspective involves dissecting the key components, noting alterations in duration and amplitude:
-
Flutter Waves: Represent rapid atrial depolarizations, creating the characteristic sawtooth pattern. The duration and amplitude of flutter waves are crucial for identification.
-
Atrial and Ventricular Rates: The atrial rate is significantly higher than the ventricular rate. The ventricular rate is determined by counting the QRS complexes within a specified time frame.
-
Regularity of Ventricular Response: Despite the rapid atrial contractions, the ventricular response remains regular, reflecting the organized conduction of impulses through the atrioventricular (AV) node.
-
Normal QRS Complex: Signifies ventricular depolarization and contraction. Its duration remains within the normal range.
Number of Cardiac Cycles for Identification: Observing a continuous strip of ECG for a brief duration, typically 10 to 15 seconds, is usually sufficient to identify Atrial Flutter. The sawtooth pattern of flutter waves and the regular ventricular response become evident within this timeframe.
Clinical Significance of Atrial Flutter: Atrial Flutter may be associated with structural heart disease, electrolyte imbalances, or pulmonary conditions. It can lead to symptoms such as palpitations, shortness of breath, or dizziness. Management strategies may include medications or procedures to restore normal rhythm.
Conclusion: In the whirlwind waltz of cardiac rhythms, Atrial Flutter emerges as a choreographed spectacle, where atrial contractions perform a rapid and organized dance. As we conclude our exploration, envision Atrial Flutter as the heart’s captivating performance, a rhythm that speaks of complexity and coordination within cardiovascular health. Join me in the upcoming sections as we unravel the tales of other cardiac rhythms, each contributing its unique tempo to the symphony of the ECG.
Atrial Fibrillation Rhythm
The Chaotic Ballet of Atrial Contractions
In the intricate ballet of cardiac rhythms, Atrial Fibrillation (AF) takes center stage as a chaotic dance, where atrial contractions lose their coordination, resembling a flurry of rapid and irregular movements. This section unveils the enigma of Atrial Fibrillation, shedding light on its nature, deciphering its implications, and navigating the ECG terrain where its disordered choreography paints a vivid yet unpredictable picture within the cardiovascular symphony.
Defining Atrial Fibrillation: Atrial Fibrillation is characterized by rapid, irregular, and disorganized atrial contractions, disrupting the synchronized dance of the heart’s upper chambers. Instead of a discernible P wave, fibrillatory (f) waves dominate the ECG, creating an erratic baseline pattern. AF can be paroxysmal (intermittent) or persistent and is often associated with conditions like hypertension, heart failure, or valvular disease.
Identifying Atrial Fibrillation on an ECG: Recognizing Atrial Fibrillation involves keen observation of the ECG, focusing on hallmark features that define its chaotic dance:
-
Fibrillatory (f) Waves: Instead of a discernible P wave, rapid and irregular f waves dominate the ECG, resembling chaotic oscillations.
-
Irregular Rhythm: The RR intervals between QRS complexes vary irregularly, reflecting the lack of organized atrial contractions.
-
Absence of a P Wave: The traditional P wave is replaced by chaotic fibrillatory waves, indicating the disarray in atrial depolarization.
Primary Lead for AF Identification: The primary lead for identifying Atrial Fibrillation is often Lead II. However, a comprehensive assessment may involve multiple leads to capture the erratic atrial activity more effectively.
Cardiac Cycle Perspective: Examining Atrial Fibrillation from a cardiac cycle perspective involves dissecting the key components, noting alterations in duration and amplitude:
-
Fibrillatory Waves: Represent disorganized atrial depolarizations, creating an erratic baseline. The duration and amplitude of fibrillatory waves vary unpredictably.
-
Irregular RR Intervals: Reflect the irregularity in ventricular response due to the chaotic atrial activity. RR intervals may vary widely.
-
Absence of a Defined PR Interval: In contrast to normal rhythms, Atrial Fibrillation lacks a consistent PR interval due to the absence of organized atrial contractions.
-
Normal QRS Complex: Signifies ventricular depolarization and contraction. Its duration remains within the normal range.
Number of Cardiac Cycles for Identification: Observing a continuous strip of ECG for a brief duration, typically 10 to 15 seconds, is usually sufficient to identify Atrial Fibrillation. The erratic fibrillatory waves and irregular RR intervals become evident within this timeframe.
Clinical Significance of Atrial Fibrillation: Atrial Fibrillation poses risks of stroke, heart failure, and other cardiovascular complications due to ineffective atrial contractions and potential clot formation. Management may involve anticoagulation, rate control, or rhythm control strategies, depending on individual patient factors.
Conclusion: In the chaotic ballet of cardiac rhythms, Atrial Fibrillation emerges as a disordered dance, where atrial contractions lose their rhythm, creating a dynamic yet unpredictable performance. As we conclude our exploration, envision Atrial Fibrillation as the heart’s erratic composition, a rhythm that speaks of complexity and challenges within cardiovascular health.
Asystole Rhythm
The Silence of the Heart’s Symphony
In the intricate orchestra of cardiac rhythms, Asystole commands a haunting silence, where the heart’s symphony abruptly ceases, and all rhythmic cadence dissolves into stillness. This section unveils the solemnity of Asystole, elucidating its essence, decoding its dire implications, and navigating the ECG terrain where the absence of any electrical activity paints a stark and ominous portrait within the cardiovascular symphony.
Defining Asystole: Asystole, often referred to as “flatline,” signifies the absence of any discernible electrical activity in the heart. It is a state of cardiac standstill where the atria and ventricles fail to depolarize and contract. Asystole is a medical emergency, and its presence on an ECG demands immediate intervention.
Identifying Asystole on an ECG: Recognizing Asystole involves a stark observation of the ECG, where the absence of any rhythmic activity is the defining feature:
-
Flatline ECG: The absence of any discernible P waves, QRS complexes, or T waves. The ECG graph paper appears as a continuous straight line, indicating the absence of electrical depolarization.
-
No Heart Rate Activity: The heart rate is essentially zero, as there are no identifiable cycles of atrial or ventricular depolarization.
Primary Lead for Asystole Identification: The primary lead for identifying Asystole is typically any lead that provides a comprehensive view of the heart’s electrical activity. In practice, multiple leads may be assessed to confirm the absence of electrical signals.
Cardiac Cycle Perspective: Examining Asystole from a cardiac cycle perspective involves acknowledging the stark absence of the usual components:
-
Flatline Absence of Waves: The lack of P waves, QRS complexes, and T waves signifies the absence of atrial and ventricular depolarization and repolarization.
-
Zero Heart Rate: In Asystole, there is no measurable heart rate, as there are no cycles of contraction and relaxation.
Number of Cardiac Cycles for Identification: Asystole can be identified instantly upon visual inspection of the ECG, as there is a continuous absence of any electrical activity. No specific duration or number of cycles is needed for confirmation.
Clinical Significance of Asystole: Asystole is a grave medical emergency and represents the cessation of effective cardiac function. Immediate intervention, such as cardiopulmonary resuscitation (CPR), advanced cardiac life support (ACLS), and potential administration of medications or electrical therapy, is necessary to attempt to restore cardiac activity.
Conclusion: In the silence of the heart’s symphony, Asystole emerges as a solemn state where the usual rhythmic dance of the heart comes to an abrupt halt. As we conclude our exploration, envision Asystole as the heart’s poignant pause, a rhythm that speaks of urgency and the need for immediate intervention within cardiovascular health.
Premature Junctional Contraction Rhythm
The Unanticipated Pause in the Heart’s Choreography
In the intricate choreography of cardiac rhythms, the Premature Junctional Contraction (PJC) emerges as an unanticipated pause, disrupting the harmonious dance of atrial and ventricular contractions. This section unveils the subtleties of PJC, elucidating its nature, decoding its implications, and navigating the ECG terrain where its unexpected interruption paints a distinctive yet transient picture within the cardiovascular symphony.
Defining Premature Junctional Contraction: Premature Junctional Contraction refers to an early, ectopic heartbeat originating in the atrioventricular (AV) junction, disrupting the normal sequence of atrial-ventricular coordination. PJCs often occur sporadically and may not follow the typical P-wave-QRS complex pattern. They can be benign or indicate underlying cardiac issues.
Identifying Premature Junctional Contraction on an ECG: Recognizing Premature Junctional Contraction involves keen observation of the ECG, focusing on features that mark its unanticipated presence:
-
Premature QRS Complex: An early QRS complex not preceded by a discernible P wave, indicating an ectopic beat originating near the AV junction.
-
Normal or Retrograde P Wave: PJCs may manifest with a normal P wave, a retrograde P wave (appearing inverted before or after the QRS complex), or no visible P wave at all.
Primary Lead for PJC Identification: The primary lead for identifying Premature Junctional Contraction is often Lead II. However, evaluation across multiple leads may be necessary to capture variations in P wave visibility and QRS morphology.
Cardiac Cycle Perspective: Examining Premature Junctional Contraction from a cardiac cycle perspective involves dissecting the key components, noting alterations in duration and amplitude:
-
Normal P Wave or Retrograde P Wave: The presence, absence, or retrograde appearance of P waves before or after the QRS complex marks the deviation from the usual atrial depolarization.
-
Premature QRS Complex: An untimely ventricular depolarization, often with a different morphology than the normal QRS complex.
-
Normal PR Interval or Shortened PR Interval: The time from atrial depolarization to ventricular depolarization may be normal or slightly shortened, depending on the proximity of the ectopic beat to the AV junction.
Number of Cardiac Cycles for Identification: Observing a continuous strip of ECG for a brief duration, typically 10 to 15 seconds, is usually sufficient to identify Premature Junctional Contraction. The unanticipated premature QRS complex and variations in P wave morphology become evident within this timeframe.
Clinical Significance of Premature Junctional Contraction: While PJCs are often benign, frequent or symptomatic occurrences may warrant further investigation to rule out underlying cardiac issues. It’s crucial to consider the context of the patient’s overall clinical condition and assess whether PJCs contribute to symptoms.
Conclusion: In the unanticipated pause of cardiac rhythms, Premature Junctional Contraction emerges as a transient deviation, disrupting the regular choreography of atrial and ventricular contractions. As we conclude our exploration, envision PJC as the heart’s unexpected pause, a rhythm that speaks of adaptability and resilience within cardiovascular health.
Atrioventricular Blocks Rhythm
Navigating the Delayed Symphony of Heart Conduction
In the intricate symphony of cardiac rhythms, Atrioventricular Blocks (AV Blocks) introduce a nuanced delay in the rhythmic transmission of electrical signals, altering the harmonious coordination between the atria and ventricles. This section unveils the subtleties of AV Blocks, elucidating their nature, deciphering their implications, and navigating the ECG terrain where the delayed conduction creates a distinctive cadence within the cardiovascular symphony.
Defining Atrioventricular Blocks: Atrioventricular Blocks refer to disruptions in the normal conduction of electrical signals from the atria to the ventricles. These blocks are categorized into three degrees, each representing a varying degree of delay or blockage in the transmission through the atrioventricular (AV) node.
Identifying Atrioventricular Blocks on an ECG: Recognizing Atrioventricular Blocks involves a nuanced observation of the ECG, focusing on specific features that denote the degree of blockage:
-
First-Degree AV Block: Prolonged PR interval, indicating delayed conduction through the AV node. All atrial impulses eventually reach the ventricles.
-
Second-Degree AV Block (Type I - Wenckebach): Progressive lengthening of PR intervals until a P wave is not followed by a QRS complex. This pattern repeats cyclically.
-
Second-Degree AV Block (Type II): Consistent PR interval, but intermittent non-conduction of atrial impulses to the ventricles, leading to dropped QRS complexes.
-
Third-Degree AV Block: Complete dissociation between atrial and ventricular activity. Atrial and ventricular rhythms are independent, resulting in a “P-P” and “R-R” relationship.
Primary Lead for AV Block Identification: The primary lead for identifying Atrioventricular Blocks varies based on the degree and pattern of blockage. Lead II is often valuable for capturing the P waves and QRS complexes, offering insights into the AV conduction.
Cardiac Cycle Perspective: Examining Atrioventricular Blocks from a cardiac cycle perspective involves dissecting the key components, noting alterations in duration and amplitude:
-
Prolonged PR Interval (First-Degree): Reflects delayed conduction through the AV node. The duration between atrial depolarization and ventricular depolarization is extended.
-
Progressive PR Interval Lengthening (Type I - Wenckebach): The PR interval gradually lengthens until a beat is dropped. The duration and amplitude of the PR interval vary cyclically.
-
Intermittent Dropped Beats (Type II): Consistent PR interval, but some atrial impulses fail to conduct to the ventricles, leading to dropped QRS complexes.
-
Complete Dissociation (Third-Degree): Atrial and ventricular activities are completely independent, each with its own rhythm. P-P intervals and R-R intervals have no fixed relationship.
Number of Cardiac Cycles for Identification: Observing a continuous strip of ECG for a brief duration, typically 10 to 15 seconds, is usually sufficient to identify Atrioventricular Blocks. The distinctive PR interval patterns and dropped beats become evident within this timeframe.
Clinical Significance of Atrioventricular Blocks: The clinical significance of Atrioventricular Blocks varies. While first-degree blocks may be benign, second-degree and third-degree blocks can lead to symptomatic bradycardia, dizziness, syncope, or heart failure. Interventions may range from monitoring and medications to pacemaker implantation.
Conclusion: In the delayed symphony of AV Blocks, the heart’s conduction introduces a nuanced cadence, altering the usual rhythmic transmission between atria and ventricles. As we conclude our exploration, envision AV Blocks as the heart’s distinctive pause and delay, rhythms that speak of the intricate interplay within cardiovascular health.
Premature Ventricular Contractions Rhythm
The Unscripted Interruption in Heart’s Melody
In the intricate melody of cardiac rhythms, Premature Ventricular Contractions (PVCs) emerge as unscripted interruptions, disrupting the orchestrated beats of the heart. This section unveils the nuances of PVCs, elucidating their nature, deciphering their implications, and navigating the ECG terrain where these untimely contractions create a distinctive yet transient dissonance within the cardiovascular symphony.
Defining Premature Ventricular Contractions: Premature Ventricular Contractions represent early, ectopic beats originating in the ventricles before the regular rhythm cycle completes. These premature contractions disrupt the normal flow of electrical impulses through the heart’s chambers.
Identifying Premature Ventricular Contractions on an ECG: Recognizing PVCs involves attentive scrutiny of the ECG, focusing on features that distinguish these premature beats:
-
Premature QRS Complex: An early, abnormal QRS complex not preceded by a P wave, indicating the ventricles initiated the contraction prematurely.
-
Wide and Bizarre QRS Morphology: The QRS complex associated with PVCs is typically wider and more distorted than the normal QRS complex.
-
Compensatory Pause: After a PVC, there is often a compensatory pause before the next normal beat, as the heart resets its rhythm.
Primary Lead for PVC Identification: The primary lead for identifying Premature Ventricular Contractions is often Lead II or V1. However, assessing multiple leads can provide a comprehensive view of the PVC morphology and its impact on different parts of the heart.
Cardiac Cycle Perspective: Examining PVCs from a cardiac cycle perspective involves dissecting the key components, noting alterations in duration and amplitude:
-
Premature QRS Complex: Represents an early ventricular depolarization, occurring before the regular sequence. The duration and amplitude of this complex may differ from the normal QRS.
-
Compensatory Pause: Following the PVC, there is a pause before the next normal beat. The duration of this pause relates to the heart’s effort to reset its rhythm.
Number of Cardiac Cycles for Identification: Observing a continuous strip of ECG for a brief duration, typically 10 to 15 seconds, is usually sufficient to identify Premature Ventricular Contractions. The untimely appearance of wide and distorted QRS complexes, along with compensatory pauses, becomes evident within this timeframe.
Clinical Significance of Premature Ventricular Contractions: While occasional PVCs are often benign, frequent or symptomatic occurrences may warrant further investigation. Persistent PVCs can be associated with underlying heart conditions, electrolyte imbalances, or stimulant use. Treatment may be necessary if PVCs contribute to symptoms or indicate an underlying issue.
Conclusion: In the unscripted interruptions of PVCs, the heart’s melody experiences transient dissonance, as premature contractions disrupt its regular cadence. As we conclude our exploration, envision PVCs as the heart’s spontaneous improvisation, rhythms that speak of adaptability and occasional discord within cardiovascular health.
Ventricular Tachycardia Rhythm
The Accelerated Crescendo of Cardiac Turmoil
In the orchestrated symphony of cardiac rhythms, Ventricular Tachycardia (VT) emerges as an accelerated crescendo, a tumultuous rhythm where the ventricles beat at an excessively rapid rate. This section delves into the intricacies of VT, unraveling its nature, decoding its implications, and navigating the ECG landscape where the relentless acceleration of ventricular contractions paints a distinctive yet concerning picture within the cardiovascular symphony.
Defining Ventricular Tachycardia: Ventricular Tachycardia is characterized by a rapid succession of three or more consecutive premature ventricular contractions (PVCs). The ventricles take control of the heart’s rhythm, leading to a sustained and accelerated heartbeat.
Identifying Ventricular Tachycardia on an ECG: Recognizing Ventricular Tachycardia involves a vigilant examination of the ECG, focusing on features that define this rapid and chaotic rhythm:
-
Wide QRS Complex: The QRS complexes associated with VT are wide and often bizarre, reflecting the abnormal ventricular depolarization.
-
Fast Ventricular Rate: VT is typified by a ventricular rate exceeding 100 beats per minute, presenting a palpably rapid and sustained rhythm.
-
Regular or Irregular Rhythm: VT can present as a regular or irregular rhythm, depending on the underlying mechanisms and the presence of any intervening normal beats.
-
Absence of P Waves: In VT, P waves are typically absent or dissociated from the QRS complexes, emphasizing the abnormal origin of the rhythm.
Primary Lead for VT Identification: The primary lead for identifying Ventricular Tachycardia is often Lead II or V1. However, assessing multiple leads can provide a comprehensive view of the wide QRS complexes and their impact on different parts of the heart.
Cardiac Cycle Perspective: Examining Ventricular Tachycardia from a cardiac cycle perspective involves dissecting the key components, noting alterations in duration and amplitude:
-
Wide QRS Complex: Signifies an aberrant ventricular depolarization, leading to an accelerated heartbeat.
-
Fast Ventricular Rate: The rapid succession of ventricular contractions shortens the cardiac cycle duration, reflecting the increased heart rate.
Number of Cardiac Cycles for Identification: Identifying Ventricular Tachycardia requires observing a continuous strip of ECG for a brief duration, typically 10 to 15 seconds. The persistent presence of wide QRS complexes, rapid ventricular rate, and absence of P waves becomes evident within this timeframe.
Clinical Significance of Ventricular Tachycardia: Ventrical Tachycardia is a serious arrhythmia with potentially life-threatening consequences. It may lead to hemodynamic instability, decreased cardiac output, and, in severe cases, degenerate into ventricular fibrillation. Immediate medical intervention, often including cardioversion or antiarrhythmic medications, is essential.
Conclusion: In the accelerated crescendo of Ventricular Tachycardia, the heart’s rhythm accelerates into a tumultuous turmoil, demanding attention and intervention. As we conclude our exploration, envision VT as the heart’s urgent call for assistance, a rhythm that speaks of potential peril within cardiovascular health.
Pulseless Ventricular Tachycardia Rhythm
When the Heart’s Symphony Falters into Silence
In the intricate symphony of cardiac rhythms, Pulseless Ventricular Tachycardia (pVT) marks a critical juncture where the rapid and chaotic beats of ventricular tachycardia deprive the heart of effective contractions, leading to a pulseless state. This section unveils the gravity of pVT, elucidating its nature, deciphering its implications, and navigating the ECG landscape where the absence of a pulse amplifies the urgency within the cardiovascular symphony.
Defining Pulseless Ventricular Tachycardia: Pulseless Ventricular Tachycardia is a life-threatening arrhythmia characterized by a rapid succession of three or more consecutive premature ventricular contractions (PVCs) with an associated absence of a palpable pulse. In this state, the heart’s rapid beats fail to generate sufficient blood flow to meet the body’s needs.
Identifying Pulseless Ventricular Tachycardia on an ECG: Recognizing pVT involves an immediate and vigilant examination of the ECG, focusing on features that define this dire situation:
-
Wide QRS Complex: Similar to regular VT, pVT is typified by wide and bizarre QRS complexes, reflecting abnormal ventricular depolarization.
-
Rapid Ventricular Rate: The ventricular rate in pVT exceeds 100 beats per minute, leading to a palpably rapid and sustained rhythm.
-
Absence of a Pulse: The defining characteristic of pVT is the absence of a palpable pulse despite the rapid ventricular activity.
Primary Lead for pVT Identification: The primary lead for identifying Pulseless Ventricular Tachycardia is often Lead II or V1. Rapid assessment across multiple leads is crucial to confirm the presence of wide QRS complexes and the absence of a palpable pulse.
Cardiac Cycle Perspective: Examining Pulseless Ventricular Tachycardia from a cardiac cycle perspective involves dissecting the key components, noting alterations in duration and amplitude:
-
Wide QRS Complex: Signifies an aberrant ventricular depolarization, leading to an accelerated but ineffective heartbeat.
-
Rapid Ventricular Rate: The rapid succession of ventricular contractions further shortens the cardiac cycle duration, exacerbating the inadequate blood flow.
Number of Cardiac Cycles for Identification: Identifying Pulseless Ventricular Tachycardia demands immediate attention, typically in a matter of seconds. The presence of wide QRS complexes and the absence of a palpable pulse become instantly apparent on visual inspection of the ECG.
Clinical Significance of Pulseless Ventricular Tachycardia: Pulseless Ventricular Tachycardia is a medical emergency requiring prompt intervention. Immediate initiation of cardiopulmonary resuscitation (CPR), defibrillation, and advanced cardiac life support measures are essential to restore effective circulation.
Conclusion: In the harrowing silence of Pulseless Ventricular Tachycardia, the heart’s rhythm accelerates into chaos, leaving a palpable void where a pulse should be. As we conclude our exploration, envision pVT as the heart’s urgent plea for immediate intervention, a rhythm that speaks of imminent peril within cardiovascular health.
Ventricular Fibrillation Rhythm
The Chaotic Crescendo of Cardiac Crisis
In the complex orchestration of cardiac rhythms, Ventricular Fibrillation (VF) emerges as a chaotic crescendo, a state where the ventricles quiver ineffectively, leading to a rapid and disorganized heartbeat. This section delves into the intricacies of VF, unraveling its nature, decoding its implications, and navigating the ECG landscape where the absence of coordinated contractions amplifies the urgency within the cardiovascular symphony.
Defining Ventricular Fibrillation: Ventricular Fibrillation is a life-threatening arrhythmia characterized by the rapid and chaotic quivering of the ventricles. In VF, the heart loses its ability to effectively pump blood, leading to a state of cardiac arrest.
Identifying Ventricular Fibrillation on an ECG: Recognizing VF involves an immediate and vigilant examination of the ECG, focusing on features that define this dire situation:
-
Chaotic Waveform: VF is typified by a chaotic and irregular waveform on the ECG, resembling a “quivering” pattern rather than organized contractions.
-
Absence of Discernible QRS Complexes or T Waves: VF is marked by the absence of clear QRS complexes or T waves, highlighting the disorganized nature of ventricular activity.
-
Lack of a Palpable Pulse: The defining characteristic of VF is the absence of a palpable pulse, indicating the ineffectiveness of ventricular contractions in generating blood flow.
Primary Lead for VF Identification: The primary lead for identifying Ventricular Fibrillation is often Lead II or V1. However, the chaotic nature of VF is evident across multiple leads, emphasizing the disorganized ventricular activity.
Cardiac Cycle Perspective: Examining Ventricular Fibrillation from a cardiac cycle perspective involves understanding the absence of coordinated contractions and the chaotic electrical activity:
-
Chaotic Waveform: Signifies the quivering of the ventricles, leading to a lack of synchronized contractions.
-
Absence of Discernible QRS Complexes or T Waves: Reflects the disorganized and ineffective ventricular activity, impeding the heart’s ability to pump blood effectively.
Number of Cardiac Cycles for Identification: Identifying Ventricular Fibrillation demands immediate attention, typically in a matter of seconds. The chaotic waveform and absence of organized ventricular contractions become instantly apparent on visual inspection of the ECG.
Clinical Significance of Ventricular Fibrillation: Ventricular Fibrillation is a medical emergency requiring immediate intervention. Prompt defibrillation, initiation of cardiopulmonary resuscitation (CPR), and advanced cardiac life support measures are essential to restore a coordinated and effective heartbeat.
Conclusion: In the chaotic crescendo of Ventricular Fibrillation, the heart’s rhythm descends into disarray, leaving the ventricles quivering without purpose. As we conclude our exploration, envision VF as the heart’s desperate plea for immediate intervention, a rhythm that speaks of imminent cardiac crisis within cardiovascular health.
Wolff-Parkinson-White Syndrome Rhythm
The Intricate Dance of Accessory Pathways
In the intricate tapestry of cardiac rhythms, Wolff-Parkinson-White (WPW) Syndrome introduces an element of complexity, characterized by the presence of accessory pathways that create abnormal electrical connections in the heart. This section delves into the nuances of WPW Syndrome, unraveling its nature, decoding its implications, and navigating the ECG landscape where the interplay of additional pathways adds a unique rhythm to the cardiovascular symphony.
Defining Wolff-Parkinson-White Syndrome: Wolff-Parkinson-White Syndrome is an arrhythmia marked by the existence of abnormal accessory pathways, known as Bundle of Kent, that create extra electrical connections between the atria and ventricles. This can lead to premature excitation of the ventricles, causing a characteristic ECG pattern.
Identifying Wolff-Parkinson-White Syndrome on an ECG: Recognizing WPW Syndrome involves a meticulous examination of the ECG, focusing on features that define this unique rhythm:
-
Shortened PR Interval: WPW Syndrome is characterized by a shortened PR interval, reflecting the accelerated conduction of electrical impulses through the accessory pathways.
-
Delta Waves: The presence of delta waves is a hallmark of WPW on the ECG. These slow-rising deflections occur at the beginning of the QRS complex and signify the early activation of the ventricles through the accessory pathways.
-
Wide QRS Complex: The QRS complex in WPW is widened due to the dual activation of the ventricles through both the normal conduction system and the accessory pathways.
Primary Lead for WPW Identification: Identifying Wolff-Parkinson-White Syndrome is often done through Lead II or V1, but the characteristic ECG findings can be observed across multiple leads. The presence of shortened PR intervals, delta waves, and widened QRS complexes is crucial for accurate diagnosis.
Cardiac Cycle Perspective: Examining WPW Syndrome from a cardiac cycle perspective involves understanding the impact of accessory pathways on the normal conduction:
-
Shortened PR Interval: Indicates accelerated conduction through the accessory pathways, bypassing the normal route.
-
Delta Waves: Signify the delayed activation of the ventricles through the accessory pathways, contributing to the widened QRS complex.
-
Wide QRS Complex: Reflects the dual activation of the ventricles, creating a unique ECG pattern.
Number of Cardiac Cycles for Identification: Identifying Wolff-Parkinson-White Syndrome requires observing a continuous strip of ECG for a brief duration, typically 10 to 15 seconds. The characteristic findings, including shortened PR intervals, delta waves, and widened QRS complexes, become evident within this timeframe.
Clinical Significance of Wolff-Parkinson-White Syndrome: While many individuals with WPW Syndrome may remain asymptomatic, some may experience episodes of tachyarrhythmias, such as atrioventricular reentrant tachycardia (AVRT). Treatment options may include medications, catheter ablation, or, in certain cases, surgical intervention.
Conclusion: In the intricate dance of Wolff-Parkinson-White Syndrome, the heart’s rhythm gains complexity, choreographed by the presence of accessory pathways. As we conclude our exploration, envision WPW as the heart’s intricate ballet, a rhythm that speaks of additional pathways contributing their unique movements to the symphony of the ECG.
Long QT Syndrome Rhythm
The Prolonged Prelude to Cardiac Disarray
In the symphony of cardiac rhythms, Long QT Syndrome (LQTS) introduces a prolonged prelude, characterized by an extended interval between ventricular depolarization and repolarization. This section unfolds the intricacies of LQTS, unraveling its nature, decoding its implications, and navigating the ECG landscape where a seemingly elongated QT interval signals a potential risk within the cardiovascular symphony.
Defining Long QT Syndrome: Long QT Syndrome is a cardiac arrhythmia marked by a delayed repolarization of the ventricles, leading to a prolonged QT interval on the ECG. This delay in repolarization can predispose individuals to a specific type of polymorphic ventricular tachycardia known as Torsades de Pointes, which can degenerate into ventricular fibrillation.
Identifying Long QT Syndrome on an ECG: Recognizing LQTS involves a careful examination of the ECG, focusing on features that define this unique rhythm:
-
Prolonged QT Interval: The hallmark of LQTS is a prolonged QT interval, measured from the start of the QRS complex to the end of the T wave. This reflects delayed ventricular repolarization.
-
Torsades de Pointes: While not always present, Torsades de Pointes is a specific type of ventricular tachycardia associated with LQTS, characterized by a twisting pattern of the QRS complexes.
-
Abnormal T Waves: LQTS may also manifest with abnormal T-wave morphology, often presenting as broad-based or notched T waves.
Primary Lead for LQTS Identification: Identifying Long QT Syndrome is typically done through Lead II or V5, but the characteristic ECG findings can be observed across multiple leads. The focus is on measuring the duration of the QT interval and observing its morphology.
Cardiac Cycle Perspective: Examining LQTS from a cardiac cycle perspective involves understanding the impact of prolonged repolarization:
-
Prolonged QT Interval: Reflects delayed repolarization, increasing the vulnerability to arrhythmias.
-
Torsades de Pointes: Represents a specific ventricular tachycardia pattern associated with LQTS, highlighting the critical nature of prolonged repolarization.
-
Abnormal T Waves: Indicate irregularities in ventricular repolarization, contributing to the prolonged QT interval.
Number of Cardiac Cycles for Identification: Identifying Long QT Syndrome requires observing a continuous strip of ECG, particularly focusing on the QT interval. The prolonged duration becomes evident within a few cardiac cycles, emphasizing the need for careful scrutiny.
Clinical Significance of Long QT Syndrome: Long QT Syndrome carries a risk of life-threatening ventricular arrhythmias. Management may involve lifestyle modifications, medications, or in some cases, implantation of an implantable cardioverter-defibrillator (ICD) to prevent sudden cardiac death.
Conclusion: In the prolonged prelude of Long QT Syndrome, the heart’s rhythm unfolds with an extended interval, signaling potential disarray within its cadence. As we conclude our exploration, envision LQTS as the heart’s cautionary sonnet, a rhythm that speaks of the delicate balance required for timely repolarization within the symphony of the ECG.
Common Artifacts and Interference in ECG Recordings
Navigating the Symphony Amidst Disturbances
As we delve deeper into the realm of ECG interpretation, it’s imperative to acknowledge the nuances introduced by common artifacts and interference that may disrupt the clarity of the cardiac rhythm melody. In this segment, we will explore the various disturbances that can infiltrate ECG recordings, from patient movements to electrical interference, shedding light on their impact and offering guidance on preserving the accuracy of this intricate cardiovascular score.
Patient Movements: The Unintended Crescendos: One of the primary challenges in obtaining pristine ECG recordings is the patient’s movements. These unintended crescendos on the ECG paper can introduce irregularities that mimic arrhythmias or obscure genuine cardiac signals. Common scenarios include patient shivering, muscle tremors, or even voluntary movements during the acquisition.
Guidance: Minimizing patient movements necessitates clear communication. Educate the individual undergoing the ECG about the importance of remaining still during the recording. Provide comfort measures, such as adjusting the room temperature, to mitigate shivering.
Electrical Interference: The Discordant Notes: Electrical interference adds discordant notes to the ECG composition. Sources like power lines, electronic devices, or poor grounding can infiltrate the recording, leading to artifacts that may mimic abnormal cardiac rhythms.
Guidance: Ensuring a shielded environment is paramount. Proper grounding of equipment, using filters to eliminate interference, and conducting ECGs in designated, shielded spaces contribute to a harmonious recording environment.
Muscle Artifacts: The Staccato Intrusions: Muscle artifacts manifest as abrupt, staccato-like interruptions on the ECG. These intrusions often result from muscle contractions, such as those occurring during patient movement, tension, or even a strong grip on the ECG electrodes.
Guidance: Emphasize relaxation during the recording. Encourage patients to avoid unnecessary muscle contractions and maintain a comfortable, relaxed posture. Proper skin preparation and electrode placement are also crucial to minimize muscle artifacts.
Baseline Drift: The Gradual Crescendo: Baseline drift presents as a gradual shift in the baseline of the ECG, potentially obscuring subtle changes in cardiac signals. This phenomenon can be attributed to factors like poor skin-electrode contact or electrode gel drying.
Guidance: Prioritize meticulous skin preparation, ensuring electrodes adhere securely. Regularly monitor and replenish electrode gel to maintain optimal conductivity. Adequate skin-electrode contact is fundamental for a stable baseline.
Lead Reversals: The Inverted Harmony: Lead reversals can lead to an inverted harmony, where the polarity of the ECG waveform is reversed. This can be a result of incorrect lead placement, creating confusion in the interpretation of cardiac events.
Guidance: Rigorous training in lead placement is indispensable. Verify electrode positioning before recording, and ensure a standardized approach to electrode placement across all ECG acquisitions.
Conclusion: In the intricate symphony of ECG interpretation, understanding and mitigating common artifacts and interference is crucial for preserving the accuracy of the cardiac melody. As we navigate through the remaining rhythms and intricacies, let’s remain attuned to the challenges that may arise, orchestrating a harmonious interplay between technology and the human cardiovascular symphony.
ECG Interpretation Tips
Mastering the Art of Cardiovascular Analysis
As we embark on the journey of ECG interpretation, honing the skills required for a nuanced understanding of cardiac rhythms becomes paramount. This segment is dedicated to providing practical tips for deciphering the intricate language written on the ECG paper. Whether you are a novice or seasoned practitioner, these insights aim to enhance your proficiency in unraveling the mysteries concealed within the rhythmic patterns of the heart.
1. Establish a Systematic Approach: The Blueprint of Interpretation: Begin your ECG analysis with a systematic approach. Start by evaluating the rhythm, heart rate, and intervals in a structured sequence. This blueprint serves as the foundation for a comprehensive interpretation, ensuring no crucial details are overlooked.
2. PQRST – The Alphabet of ECG: Understanding the PQRST sequence is akin to mastering the alphabet of ECG interpretation. Pay meticulous attention to each component:
- P Wave: Represents atrial depolarization.
- QRS Complex: Signifies ventricular depolarization.
- T Wave: Marks ventricular repolarization.
Grasping the significance of each component lays the groundwork for discerning normal and aberrant rhythms.
3. Heart Rate Calculation: The Pulse of Interpretation: Mastering heart rate calculation is fundamental. Whether using the standard 300-150-100-75-60-50 method or the RR interval, accurately determining heart rate is the pulse of ECG interpretation.
4. Identify the Axis: The Directional Compass: Understanding the cardiac axis provides insights into chamber hypertrophy and conduction abnormalities. Use Lead I and Lead AVF to determine the axis and unveil hidden cardiac clues.
5. Recognize Ischemic Changes: Decoding Myocardial Messages: ST-segment changes and T-wave abnormalities can be subtle indicators of myocardial ischemia. Familiarize yourself with patterns indicative of ischemic events, ensuring timely intervention.
6. Beware of Artifacts: The Masqueraders of Rhythms: Artifacts can masquerade as genuine rhythms, leading to misinterpretation. Differentiate between true cardiac signals and artifacts caused by patient movements, electrical interference, or equipment malfunctions.
7. Know the Normal Variants: Discerning Normal from Abnormal: Understanding normal variants prevents misinterpretation. Features like early repolarization, benign T-wave inversions, and athletic heart adaptations are crucial differentiators.
8. Delve into Complex Patterns: Navigating the Cardiac Labyrinth: Approach complex patterns with a methodical mindset. Break down intricate arrhythmias into manageable segments, focusing on one element at a time to unravel their complexity.
9. Continuous Learning: The Ever-Evolving Symphony: The field of ECG interpretation is dynamic. Embrace continuous learning to stay abreast of emerging insights, new findings, and evolving guidelines, enriching your interpretative skills over time.
10. Consult Colleagues: The Collaborative Harmonies: Engage in collaborative interpretation. Seeking insights from colleagues, especially in challenging cases, fosters a collaborative approach, enriching the collective knowledge base.
11. Document Thoroughly: The Chronicles of Interpretation: Accurate documentation is the chronicle of interpretation. Maintain meticulous records, detailing your observations, interpretations, and any interventions initiated based on ECG findings.
As we navigate the intricacies of ECG interpretation, let these practical tips serve as a compass, guiding you through the labyrinth of cardiac rhythms. Each ECG is a unique symphony, and with a discerning ear and a practiced eye, you can unravel the melodies encoded within the heart’s rhythmic tapestry.
Closing the Chapters
A Symphony of ECG Mastery
In concluding this comprehensive exploration of electrocardiography, we’ve embarked on a journey that unveils the intricacies of ECG interpretation. From understanding the fundamental principles of ECG technology to navigating the diverse landscape of cardiac rhythms, each page has been a step toward mastery in the field of cardiology.
The journey began with demystifying the origins and nomenclature of ECG, delving into its historical tapestry. We then ventured into the mechanics of ECG, dissecting the layout, leads, and the cardiac cycle itself. Calculating heart rates became an art, with insights into the various methods and nuances of interpretation.
Our odyssey extended to the realm of cardiac rhythms, unraveling the mysteries of each beat and pause that orchestrates the heart’s symphony. From the familiar rhythms like Normal Sinus to the more intricate patterns such as Atrial Fibrillation and Ventricular Tachycardia, we explored their meanings and intricacies.
As technology continues its relentless march forward, we gazed into the future, witnessing the emergence of wearable devices, artificial intelligence, and telemedicine in the realm of ECG. The convergence of innovation promises a landscape where personalized, continuous cardiac care becomes the norm, transcending the boundaries of traditional healthcare.
Our journey also touched upon the practicalities of ECG interpretation – the tips, pitfalls, and the evolving trends that will shape the future of cardiovascular diagnostics. We delved into the world of artifacts, the nuances of signal processing, and the integration of ECG data into electronic health records, ensuring a seamless flow of information for comprehensive patient care.
In the final chapters, we navigated through the ever-expanding horizons of ECG technology, from augmented and virtual reality in education to the secure management of patient data through blockchain technology. The future promises not just technological advancements but a paradigm shift in how we perceive, diagnose, and manage cardiac health.
As the book metaphorically closes, let this journey serve as a compass for those venturing into the realm of ECG interpretation. May the knowledge gleaned from these pages resonate in the minds and practices of healthcare professionals, contributing to a future where cardiac care is not just reactive but proactive, personalized, and seamlessly integrated into the fabric of everyday life.